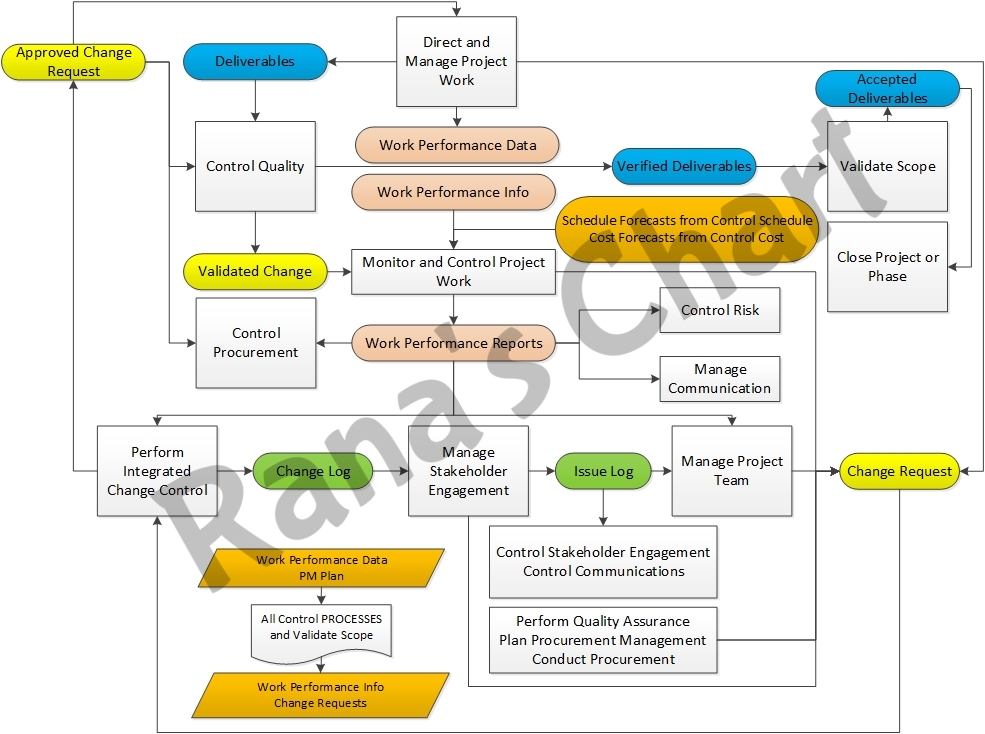
I felt that an attempt to memorize all the ITTOs was a very daunting task. So I tried to look for ways to understand core concepts and process flow that could be a substitute for complete memorization. I focused on just a handful of diagrams in the PMBOK to do this:
Page 59, Figure 3-5. Project Data, Information and Report Flow
• Work Performance Data is output from execution and input to controlling processes.
• Work Performance Information is output from Controlling Processes and input to Overall Project Control.
• Work Performance Reports are output from overall project control and input to Project Change Control, Project Management Plan, and Project Communications.
Getting a feel for practice exams, it quickly became clear that knowledge of the interaction between Process Groups would be a key. This led me to Chapter 4, Integration Management diagrams:
Page 67, Figure 4-3. Develop Project Charter Data Flow Diagram
It was easier for me studying this diagram to gain an understanding of the inputs to and Outputs from Develop Project Charter.
Page 73, Figure 4-5. Develop Project Management Plan Data Flow Diagram
Used this diagram to understand the myriad places for which the Project Management Plan is an input. And equally important, the Project Management Plan houses baselines, therefore several outputs from other processes are inputs to the Project Management Plan.
Page 80, Figure 4-7. Direct and Manage Project Work: Data Flow Diagram
A key here is recognizing that Direct and Management Project Work output (Work Performance Data) is input to all but one of the other knowledge areas Control process ( HR does not have a control process).
Page 87, Figure 4-9. Monitor and Control Project Work Flow Diagram
My favorite! I just had to know that ALL of the Control processes had outputs (Work Performance Information and a few other things) which were inputs to Monitor and Control Project Work. Useful!
Page 95, Figure 4-11. Perform Integrated Change Control Data Flow Diagram
Much of the same. All of the Control processes have outputs (in the form of change requests) which are inputs to Perform Integrated Change Control.
Page 101, Figure 4-13. Close Project of Phase Data Flow Diagram
This diagram helps clear up all that goes into closing a project or phase. For me, a stumbling block was understanding the difference between verify and accepting deliverables and that accepted deliverables are of course an input to Close Project or Phase.
I did attempt a Flash Card memorization of ITTOs, but my understanding of the above diagrams served me better on the actual test. There was a definite focus on how everything was tied together and questions which spanned multiple Process Groups.

